
How to view payment analytics in the Bolt Merchant Dashboard.
Payment Analytics displays a breakdown of revenue by method of payment (e.g., card network).
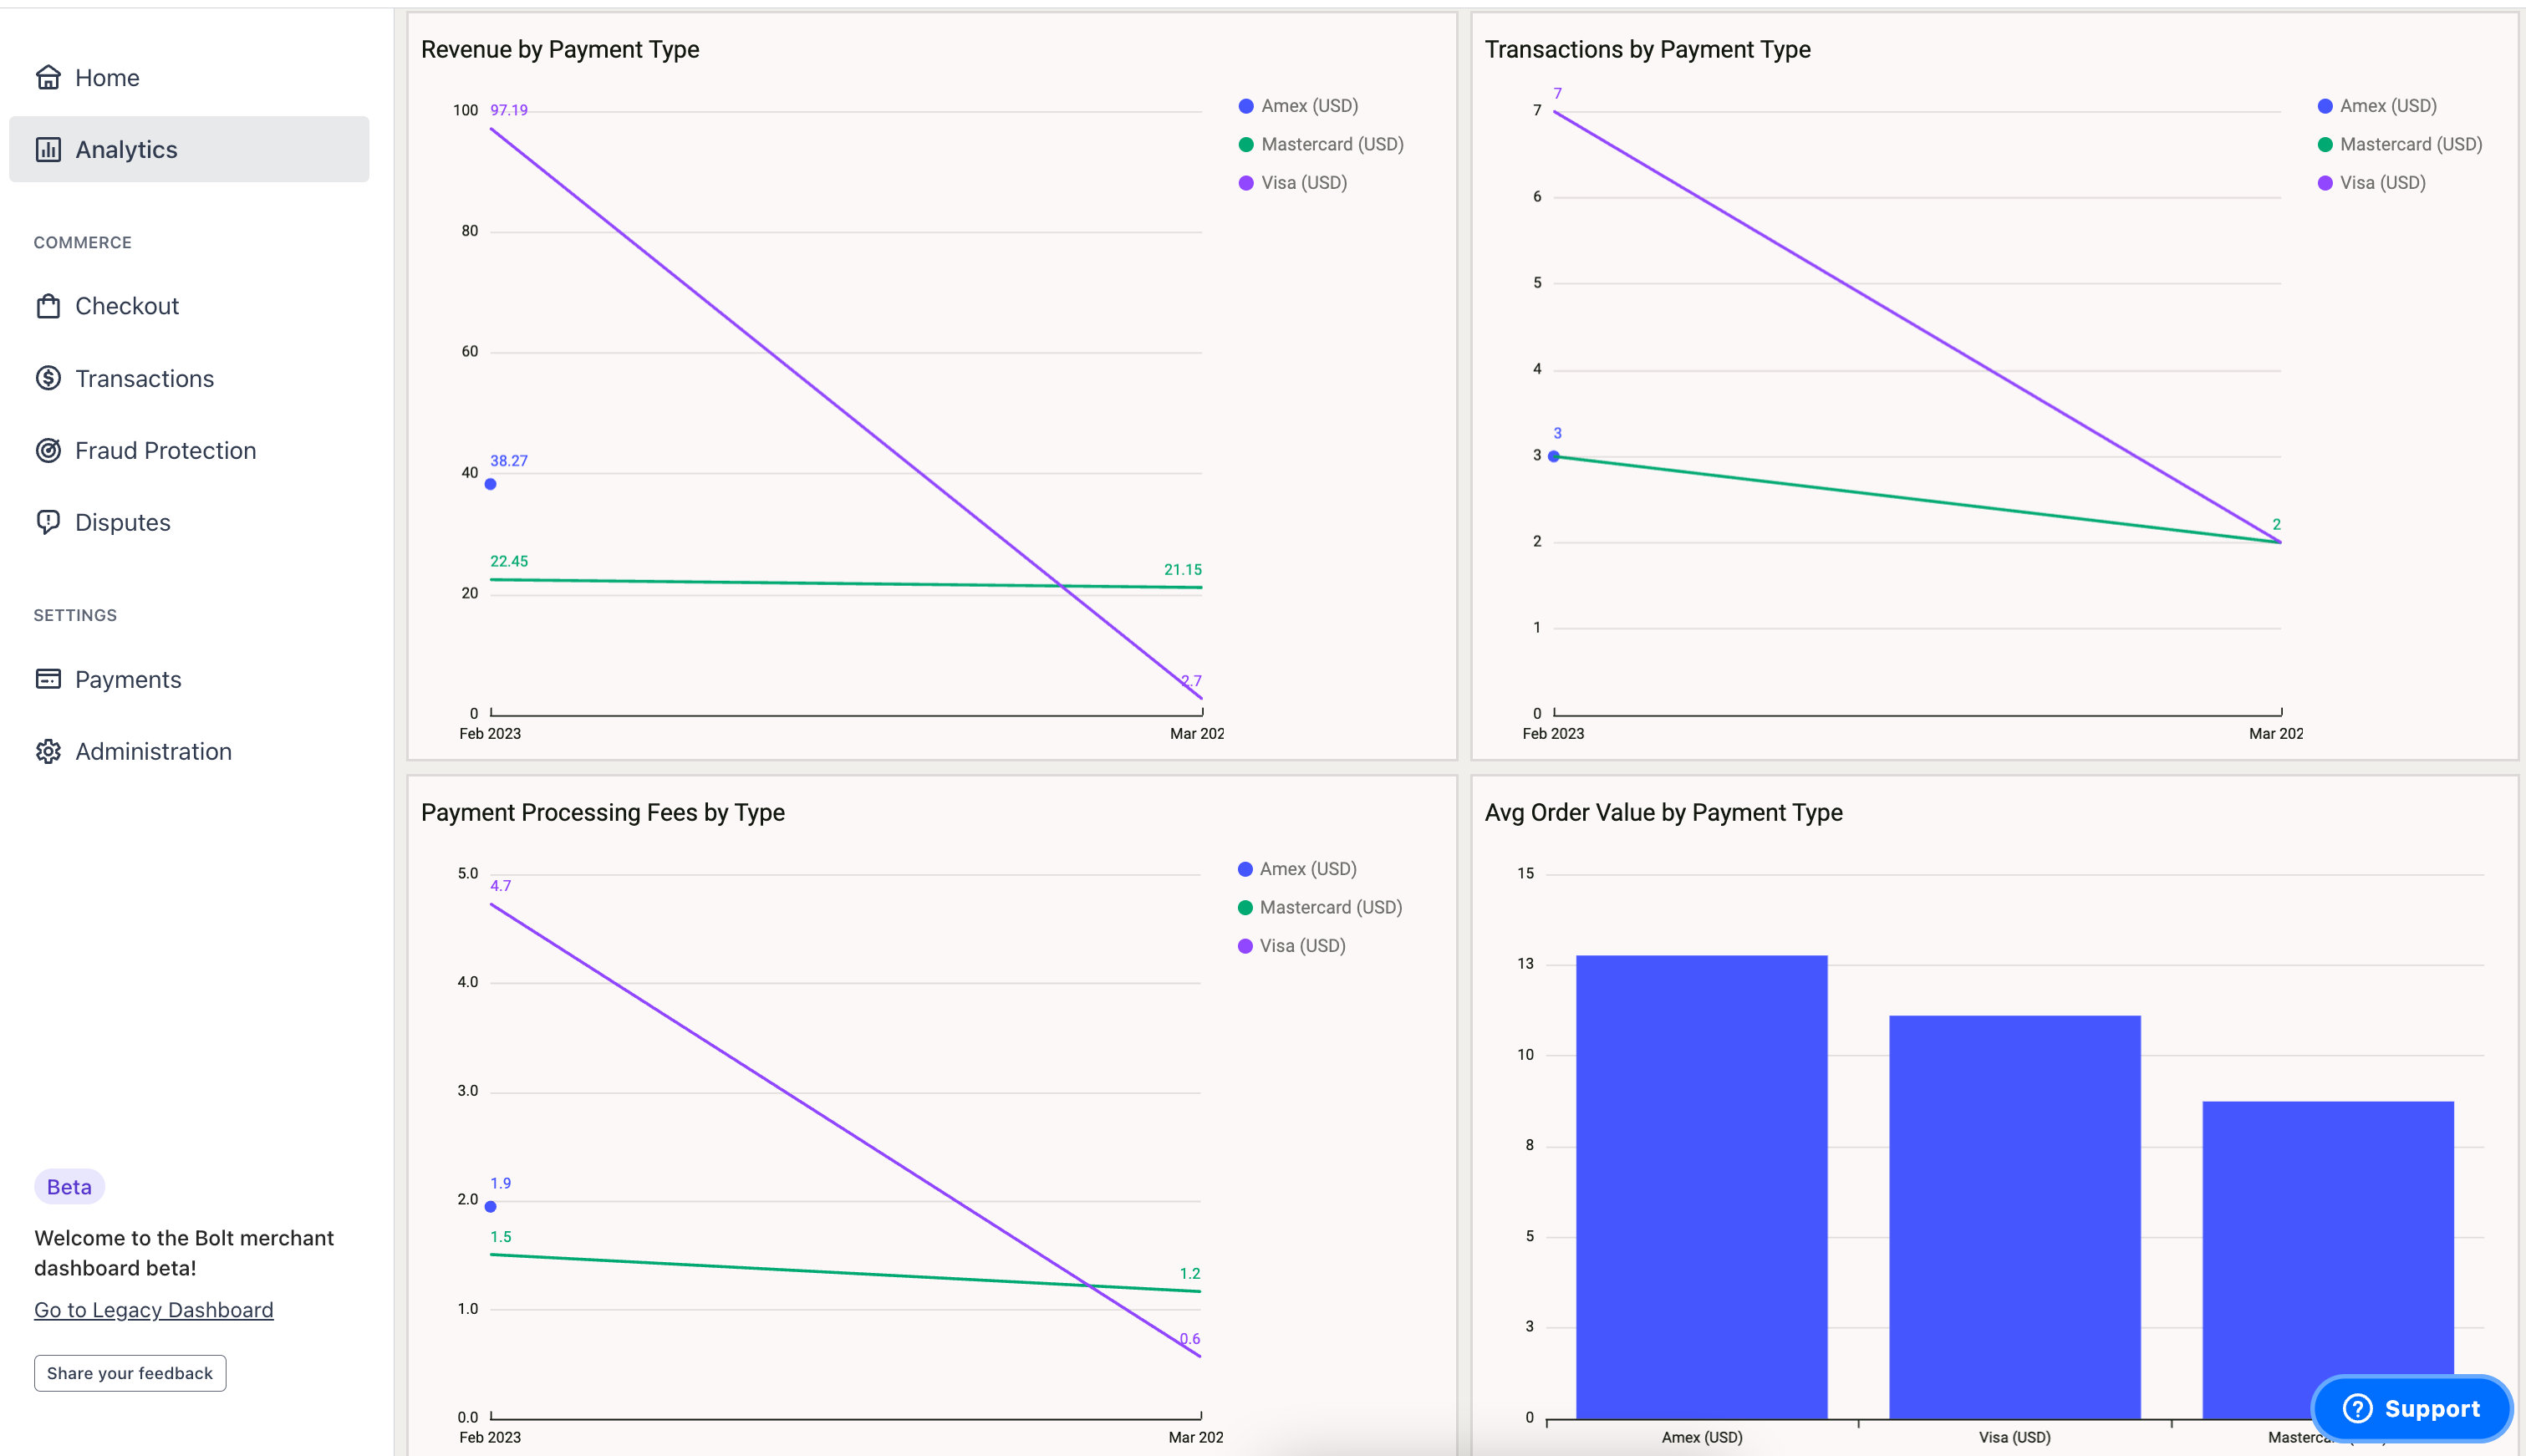
Payment Analytics
| Metric | Type | Description |
|---|---|---|
| Revenue by Payment Type | Line Graph | Weekly aggregation of revenue organized by payment types (Visa, Mastercard, Amex, etc). |
| Transactions by Payment Type | Line Graph | List of payment types (Visa, Mastercard, Amex, etc) broken down by total transactions. |
| Payment Processing Fees by Type | Line Graph | Displays payment processing fees by payment type. |
| Transactions by Payment Type | Line Graph | Weekly aggregation of transaction count broken down by payment types. |
| Avg Order Value | Bar Graph | Average order value broken down by payment type for the defined scope. |
| Refund Amount by Payment Type | Chart | Displays the monthly total value of refunds by payment type. |
| Number of Refunded Transactions by Payment Type | Chart | Displays a count of refunded transactions for each month by payment type. |
| Average Refund Amount by Payment Type | Chart | Displays the average refund amount per month for each payment type. |
| Future Funding Amount | Chart | Displays future expected funding from payment processors. |
| Historical Funding | Table | Day and funding payment amount. |
| Historical Funding | Chart | Day and Funding Payment amount. |
Controls
| Data |
|---|
| Start Date |
| End Date |
| Payment Type |
| Platform Type |
| Merchant Division |