
How to view geographic analytics in the Bolt Merchant Dashboard.
The Geography Dashboard provides a heatmap of transactions across the United States. This data can be filtered to create a custom scope on available data.
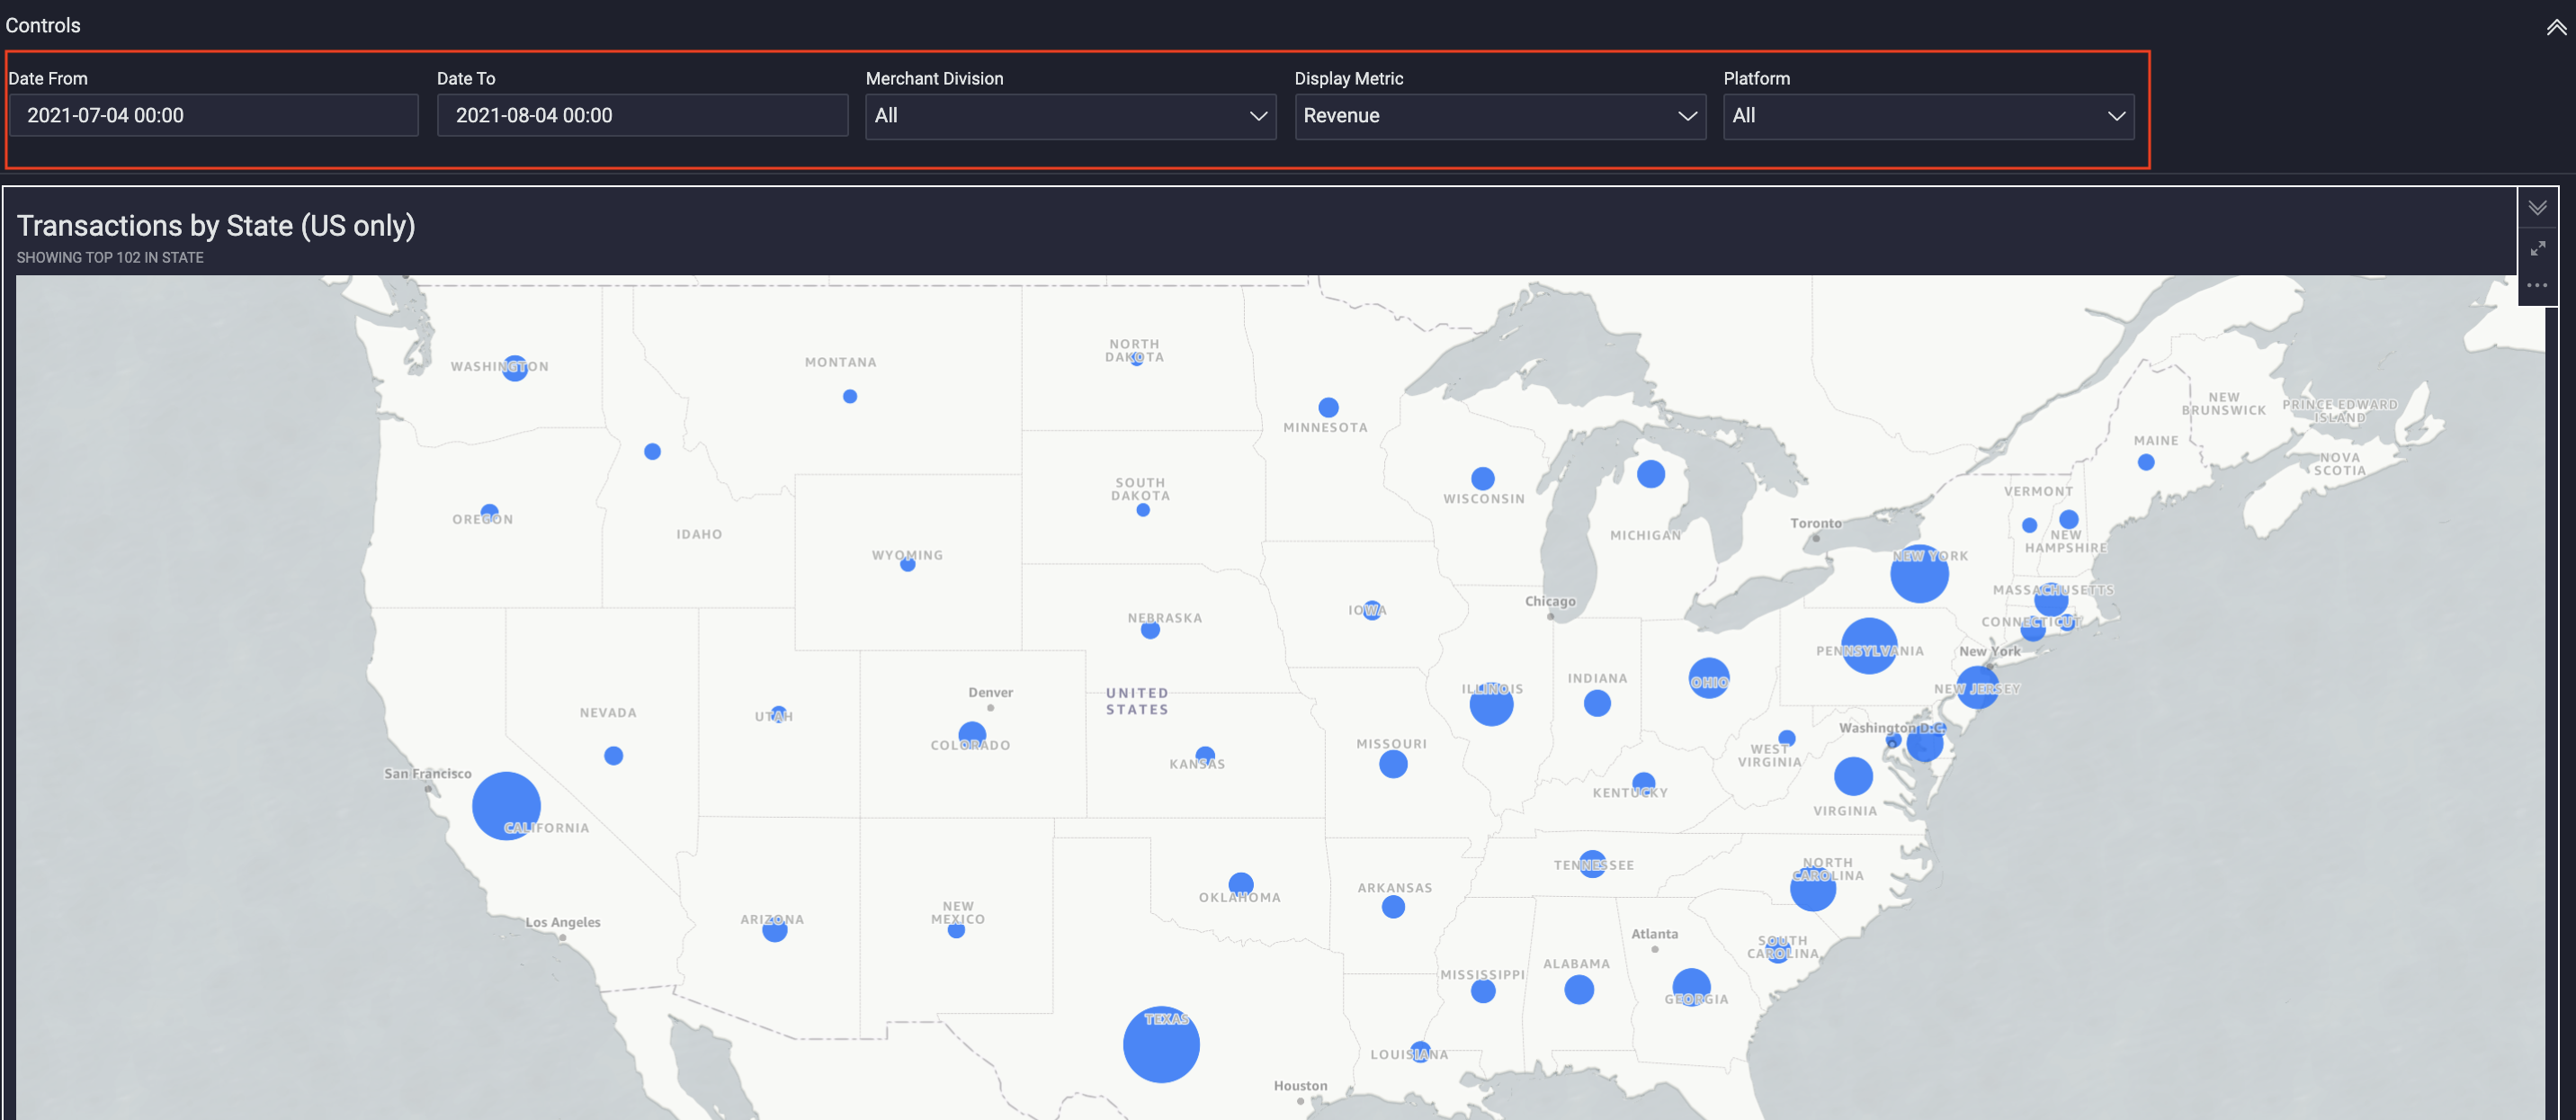
Filters
- Date From: The beginning of the date range in which to scope transaction data.
- Date To: The end of the date range in which to scope transaction data.
- Merchant Division: The merchant division(s) within scope; the default is
All, which scopes displayed data across all merchant divisions. - Display Metric: Filters the displayed data by the following types.
- Transaction Count: (DEFAULT) Filters the displayed transaction data by number of transactions.
- Revenue: Filters the displayed data by amount of revenue generated in US dollars.
- Platform: Filters displayed data by the type of device used to make transactions.
Controls
See the Controls section for a list of all options.