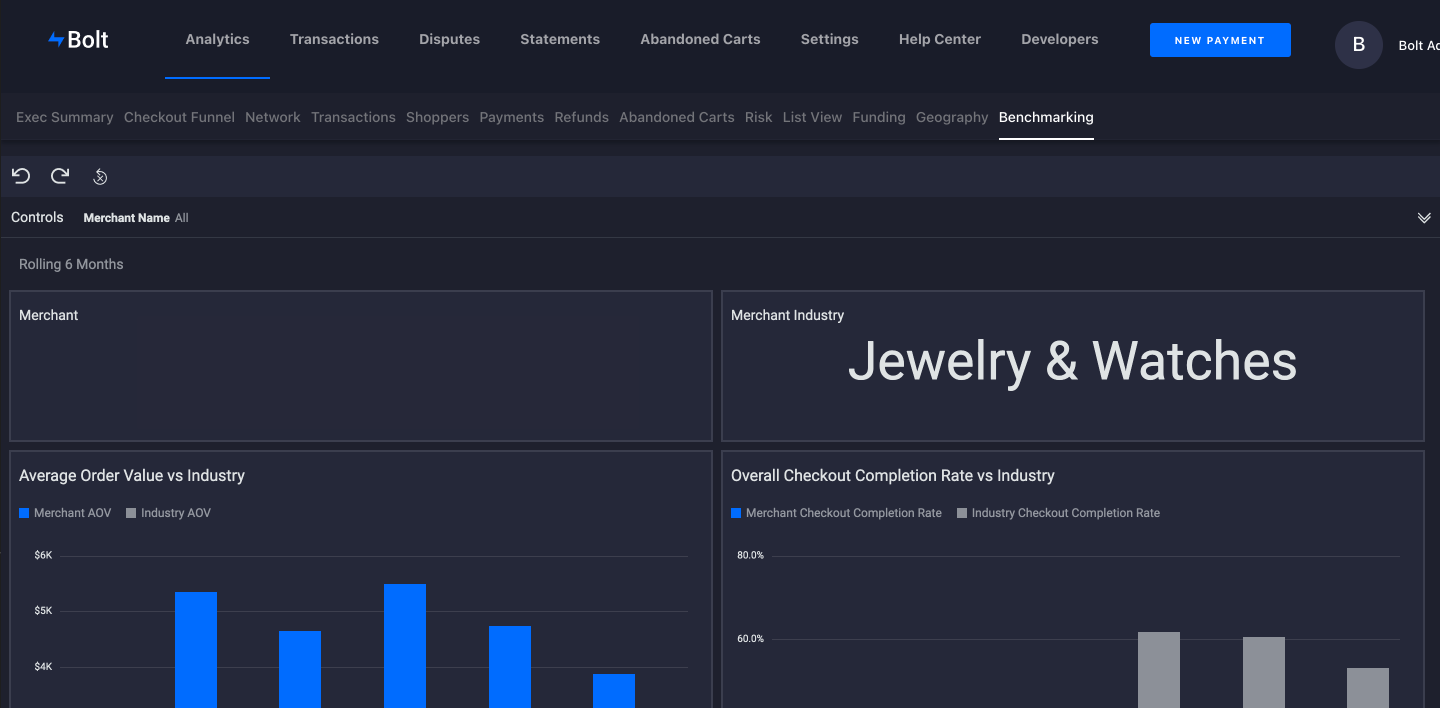
Benchmarking Dashboard analytics in the Bolt Merchant Dashboard.
Benchmarking Dashboard Analytics displays a visualization of your Bolt checkout analytics compared to the performance of other Merchants using Bolt checkout in a single dashboard. This is great for seeing how you’re doing in the Bolt Network compared to others in your industry.

Reports
| Graph | Definition |
|---|---|
| Average Order Value vs Industry | Compared to other merchants in your industry, what is the average amount (in U.S. dollars) your shoppers are spending per order. |
| Overall Checkout Completion Rate vs Industry | Over the past six to seven months, what percentage of shoppers completed your checkout funnel compared to other merchants in your industry. |
| Percentage of Transactions from Bolt Accounts vs Industry | Percentage of your checkout transactions from shoppers with a Bolt Network account compared to others in your industry. |
| Checkout Registration Rate of Guest Shoppers vs Industry | Percentage of shoppers who signed up for a Bolt Network account using your checkout compared to others in your industry. |
| Percentage of GMV from Cross Network vs Industry | Gross Merchandise Value in U.S. dollars of sales through Bolt from shoppers in the Bolt Network compared to others in your industry. |
Terms
| Term | Definition |
|---|---|
| GMV | Gross Merchandise Value in U.S. dollars of sales through Bolt. |
| Checkout Completion Rate | Number of checkout completions in time frame divided by the number of checkout starts. |
| Checkout Session | Each unique shopping intent starts when the unique user first interacts with Bolt (any registered checkout event from them) and there is no ongoing session. A session ends after:
|
Controls
See the Controls section for a list of all options.
