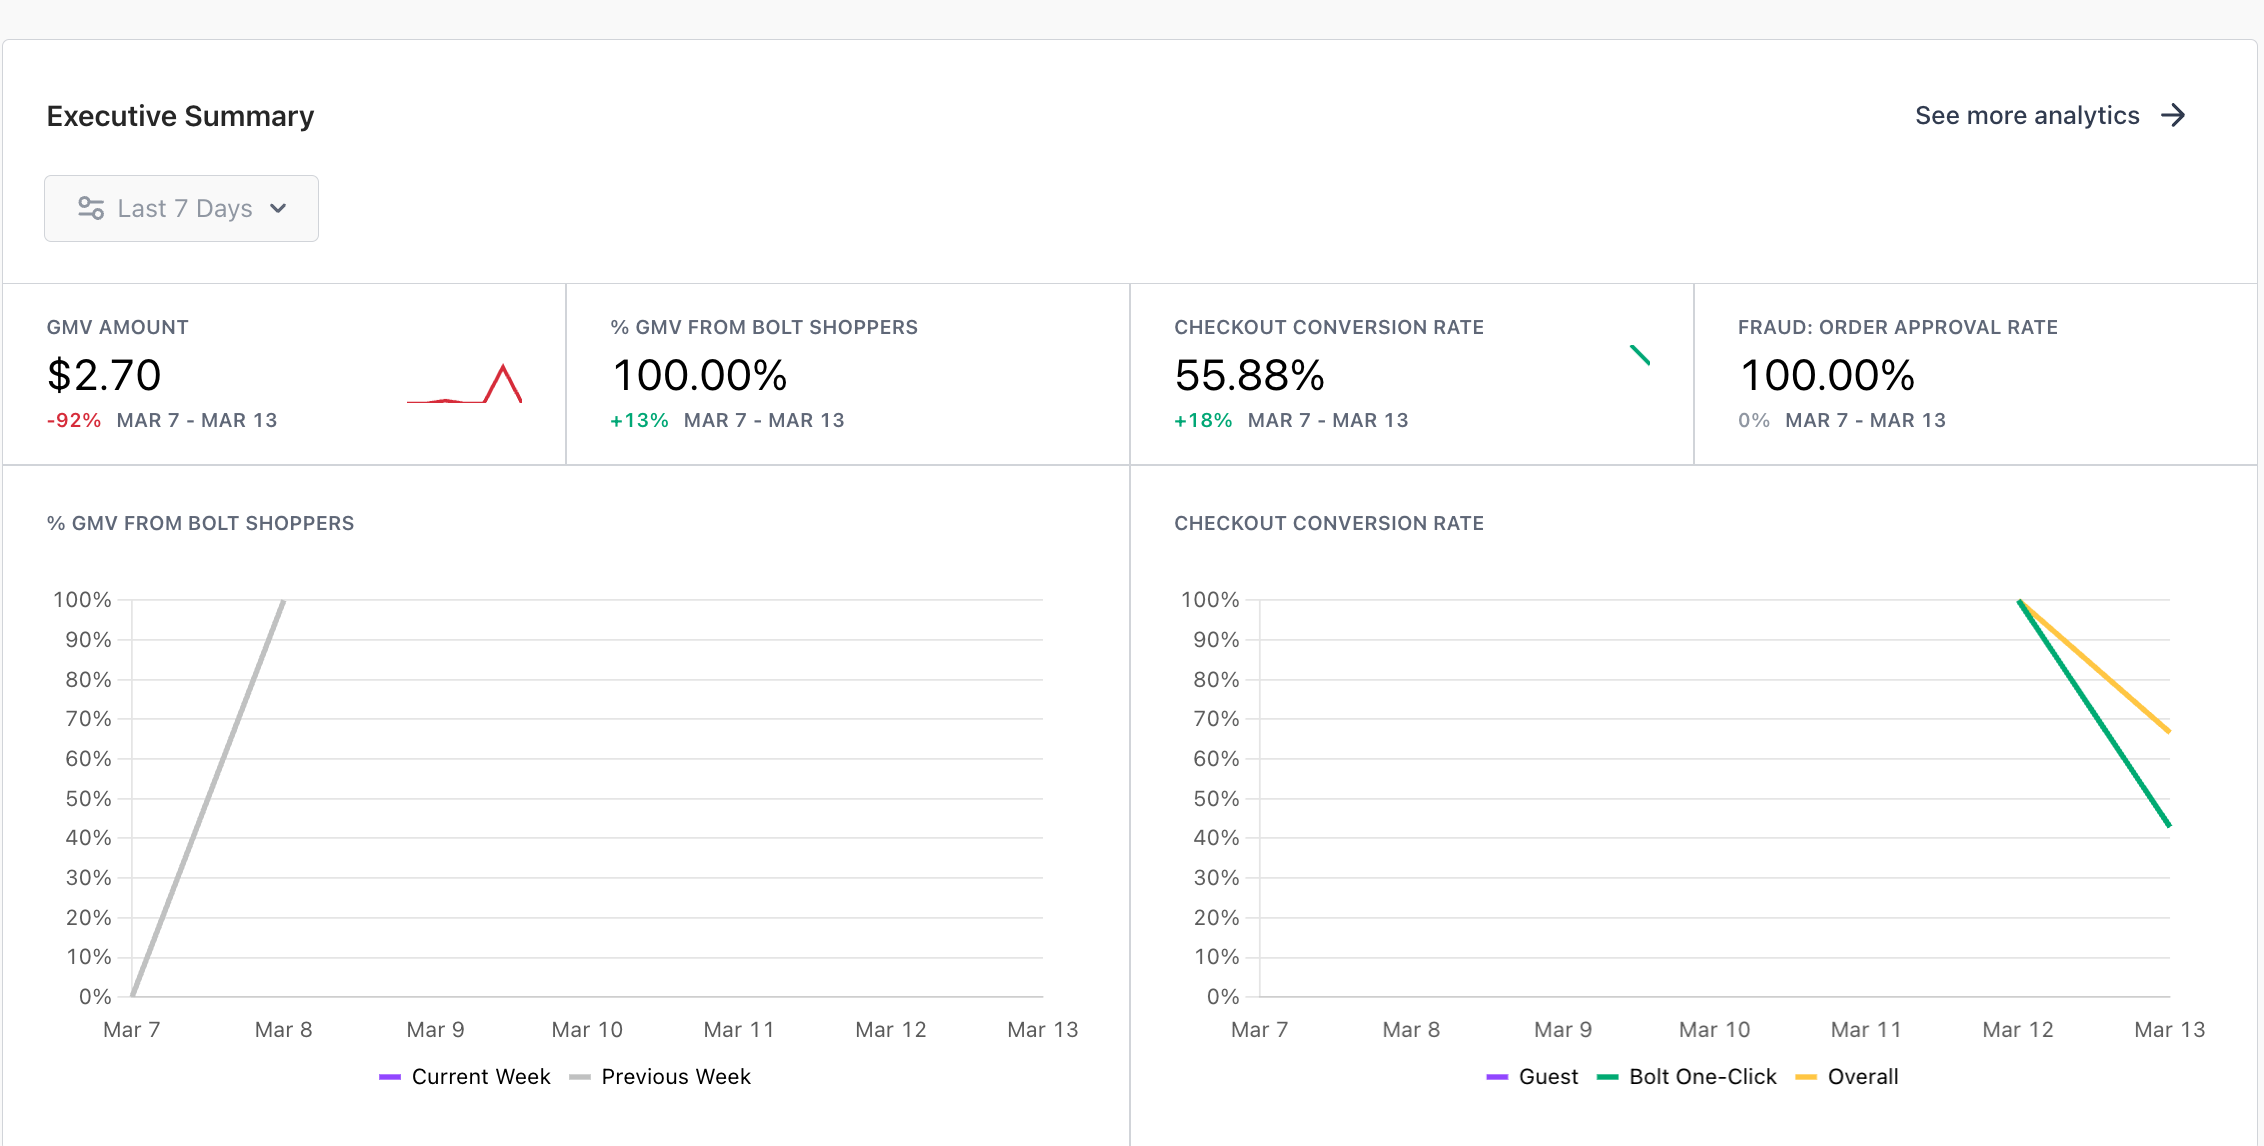
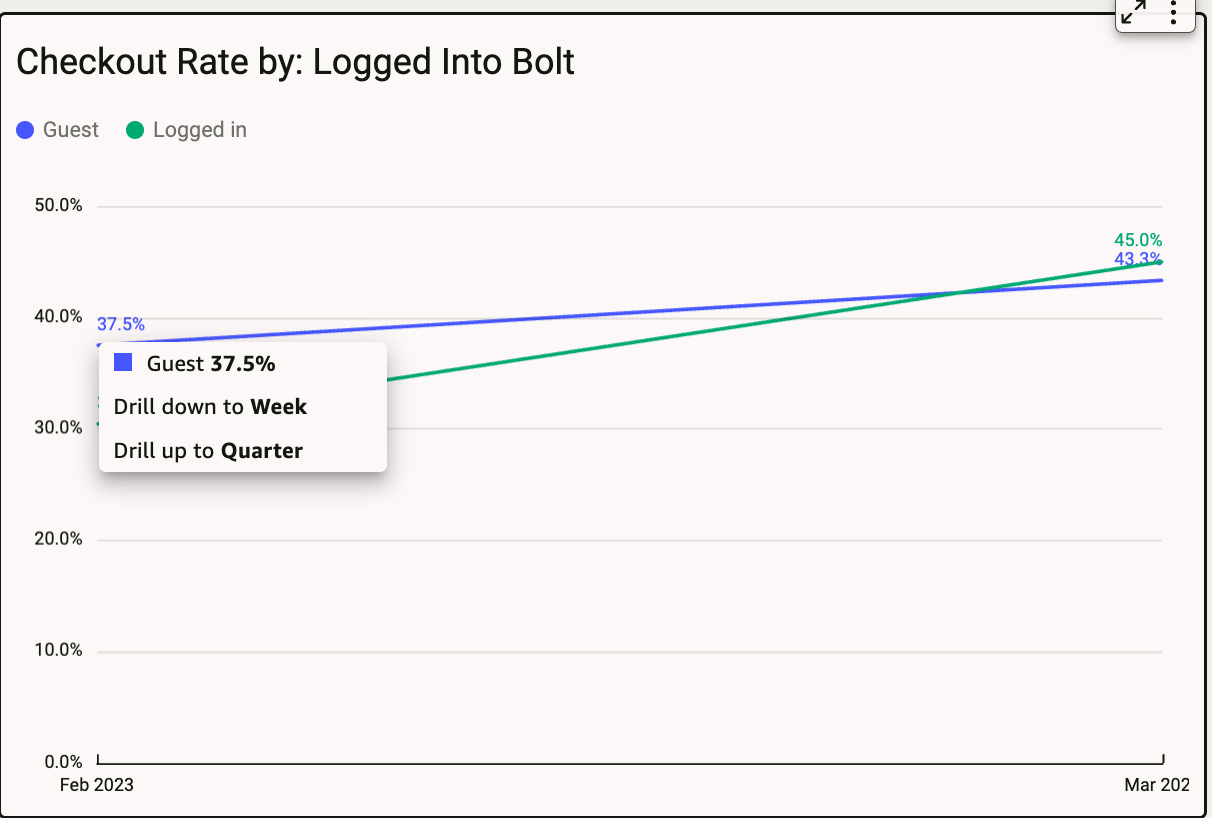
📍 Bolt Help / Dashboard / Analytics Analytics See the checkout analytics the Merchant Dashboard offers. Merchants can view analytics by navigating to the Analytics tab. Analytics include data trends across transactions, payments, risk analysis outcomes, and funding. Information displayed is updated hourly. NOTE You must have Administrator or Analyst permissions to view the Analytics tab. See Role Permissions for a full list of permissions available. How to View Analytics Log in to the Bolt Merchant Dashboard. Navigate to Analytics. Select a view. ControlsUse controls to filter, export, print, and sort analytics. Add Filters Click to expand. Log in to the Bolt Merchant Dashboard. Navigate to Analytics. Select a view. Use the Controls toolbar to expand filters. Select a filter from the options. The view is automatically updated to reflect changes to filters applied. Reset Filters Click to expand. Log in to the Bolt Merchant Dashboard. Navigate to Analytics. Select a view. Scroll to Controls and click on the control you wish to reset. Hover over the title until a three dots icon appears and select Reset. TIP You can also select the reset icon located in the main controls bar to reset all filters at once. Undo / Redo Filters Click to expand. Log in to the Bolt Merchant Dashboard. Navigate to Analytics. Select a view. Scroll to Controls. Define your filters. Select the Back or Forward icon. Export Click to expand. Log in to the Bolt Merchant Dashboard. Navigate to Analytics. Select a view. Hover over the title of a metric. Select the three dots icon > Export to CSV. Select Done once the download is complete. Set Date Range Click to expand. Some visualizations can toggle between a quarterly, monthly, daily, and hourly view of your metrics. Log in to the Bolt Merchant Dashboard. Navigate to Analytics. Select a view. Double-click the visualization to select it. The visualization highlights with a white border. Hover over a plot point and select the line. Select Drill up to […] or Drill down to […] to modify the granularity of the time frame. TIP You can drill down into hourly from the Day level of granularity by selecting the Drill down from timestamp button in the visualization’s control options. Sort Click to expand. All tables can be sorted by selecting the column header and toggling between the following organization options: Strings: az-za Numbers (including dates): ascending - descending. Available Reports Abandoned Cart Analytics How to view abandoned cart analytics in the Bolt Merchant Dashboard. Checkout Funnel Analytics Checkout Funnel analytics in the Bolt Merchant Dashboard. Executive Summary Dashboard Analytics Executive Dashboard analytics in the Bolt Merchant Dashboard. Payment Analytics How to view payment analytics in the Bolt Merchant Dashboard. Risk Analytics How to view risk analytics in the Bolt Merchant Dashboard. Shopper Analytics How to view shopper analytics in the Bolt Merchant Dashboard. Store Insights Understanding Store Insights Transaction Analytics How to view transaction analytics in the Bolt Merchant Dashboard.